
What do we know about the air quality in Palermo?
Some weeks ago we came across an EU publication about the urban life in 79 European cities . Among the surveyed cities was Palermo. The following graphic on page 50 attracted our interest. The graphic shows the proportion of people satisfied with public transport services and the quality of air in their city. For both indicators Palermo shows very low levels.

We became interested in what kind of air quality data are currently available in Palermo. The central agency which collects and publish information about air quality is RAP Palermo. According to their website the monitoring network in Palermo is build on ten stations. RAP Palermo collects data in five key pollutants (sulfur oxides (SO2), carbone dioxyde (CO2), nitrogen oxides (NO2), ozone (O3) and particulate matter (PM10)) 24 hours per day.
The results are publish on their website as daily and monthly reports and are available from the year 2013. This is the daily report for the September, 16.

The page shows that not all stations collect data for every pollutant. Grey fields indicate combinations which are not measured. We call them “missing type 1” data. White fields on the other hand are under observation but for this particular day are not available (“nd”). These are “missing type 2” data. Valid measurements are the fields containing a value and are in green, yellow or red. Only the stations Boccadifalco and Castelnuovo collect data for all five pollutants.
The most interesting data to make some analysis are the daily one, but in RAP website there are two information barriers:
- there is one file for every day, than it’s necessary to download one by one. In one year it’s necessary to do 365 downloads;
- all files are in PDF format, than it’s impossible to use them in apps to make some analysis like a spreadsheet, or in some statistical framework.
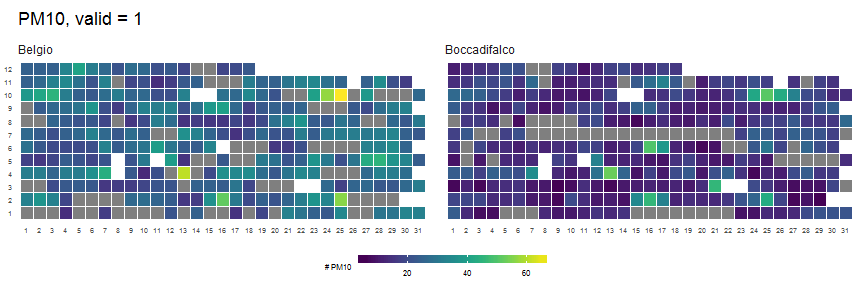
So we had to deal with this. We downloaded in example all available daily reports for the year 2016 and extracted the data: here the 2016 RAP daily data in a single CSV file.
We have build 2 different procedures to do it: one in R (the one of Patrick) and one in Python (the one of Andy), and we will publish them in the next weeks.
Why it’s better in this way
To have a single file, in a format that you can use to make calculation, visualization and analysis it’s a little treasure.

Some examples:
- it’s possible to compare different time periods (think to “ZTL”, the restricted traffic area which began in Palermo on 2016 October 10);
- it’s simple to build automation tools (alert me every time in this station PM10 overcomes legal limit); it will be always the data of the day before, but we think that it’s much better than nothing, much better than to look every day to a PDF file via a browser;
- it’s possible to use this data coupled to other kind of data (rain and wind data in example) to do some more advanced environmental analysis;
- it’s possible to discover that:
- there are no records about Bellolampo station in the PDF. Why?
- there are to much days in which there are no data, also for fundamental measures like PM10 one. Why?
- along one year it is forbidden to have more than 35 days with PM10 > µg/m3. In Di Blasi station (outside the ZTL) we already have it 33 times; moreover for this station there had 21 days without any measures.
- some files like bollettino_20161126.pdf, bollettino_20160508.pdf and bollettino_20160408.pdf, are not published.
This post is a first step, a kind of introduction. In the next weeks we will open a website dedicated to these data, in which we will publish: more data, the code we will use to download them, some maps, some charts, some interactive visualizations and some posts about these data.
Stay tuned!